UI Components
Statistics Components
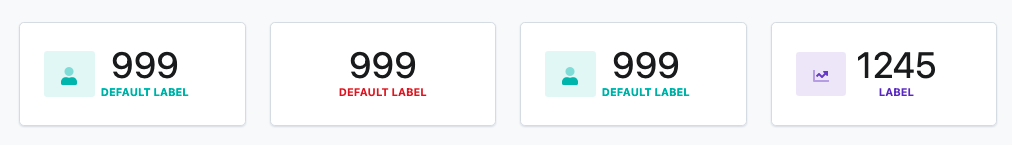
Statistics components provide an elegant way to display important single-value metrics in your application. These visually appealing components combine values, labels, and icons to highlight key data points for users.
Overview
Statistics components are designed to present focused metrics that give users immediate insights into application data. Built on Livewire, these components are dynamic, reactive, and easy to customize.
Installation
Statistics components are included in the Laravolt UI package. If you haven't installed Laravolt UI yet, refer to the installation guide.
The statistics component relies on Laravel Livewire, which should be installed as part of the Laravolt installation process.
Basic Usage
Creating a Statistics Component
To create a new statistics component, use the Artisan command:
php artisan make:statistic TotalUserThis command generates a new Livewire component class in the app/Http/Livewire/Statistic directory. The generated class extends Laravolt\Ui\Statistic and provides a template for you to customize:
<?phpnamespace App\Http\Livewire\Statistic;use Laravolt\Ui\Statistic;class TotalUser extends Statistic{ public string $label = 'Total User'; public ?string $icon = 'user'; public function value(): int|string { return \App\Models\User::count(); }}Displaying a Statistics Component
Once created, you can display your statistic component in any Blade view using one of these methods:
<livewire:statistic.total-user />{{-- Or using the @livewire directive --}}@livewire('statistic.total-user'){{-- Or using the full class name --}}@livewire(\App\Http\Livewire\Statistic\TotalUser::class)You can include multiple statistics components in the same view to create dashboards:
<div class="ui three statistics"> <livewire:statistic.total-user /> <livewire:statistic.active-user /> <livewire:statistic.new-registrations /></div>Customization
Label Customization
The label appears below the value and describes what the statistic represents. You can set a static label using the $label property:
public string $label = 'Total Users';For dynamic labels that change based on external factors, override the label() method:
public function label(): string{ $month = request()->query('month', date('F')); return "New Users in {$month}";}Value Configuration
The value is the main focus of a statistics component. Override the value() method to determine what value should be displayed:
public function value(): int|string{ // Simple count return \App\Models\User::count(); // More complex calculation $startDate = now()->startOfMonth(); $endDate = now()->endOfMonth(); return \App\Models\User::whereBetween('created_at', [$startDate, $endDate])->count();}You can format the value for better readability:
public function value(): int|string{ $amount = Order::sum('total'); return 'Rp ' . number_format($amount, 0, ',', '.');}Color Options
Set the component's color using the $color property:
public ?string $color = 'red';Available color options include:
- red
- orange
- yellow
- olive
- green
- teal
- blue
- violet
- purple
- pink
- brown
- grey
- black
For dynamic colors that change based on the value or other conditions, override the color() method:
public function color(): ?string{ $value = $this->value(); if ($value > 1000) { return 'green'; } elseif ($value > 500) { return 'blue'; } else { return 'red'; }}Icon Selection
Set an icon using the $icon property:
public ?string $icon = 'user';For dynamic icons that change based on conditions, override the icon() method:
public function icon(): ?string{ $trend = $this->calculateTrend(); if ($trend === 'up') { return 'arrow-up'; } elseif ($trend === 'down') { return 'arrow-down'; } return 'minus';}Laravolt statistics components use Font Awesome v5 Duotone icons. You can browse the available icons at Font Awesome.
Advanced Features
Polling for Real-time Updates
You can make your statistics update automatically at regular intervals by adding Livewire's polling feature:
class ActiveUsers extends Statistic{ // Update every 5 seconds protected $listeners = ['$refresh']; protected $polling = 5000; // Rest of the class}Conditional Display
You can conditionally show or hide specific elements of your statistic component:
public function shouldDisplayIcon(): bool{ return $this->value() > 0;}Custom Templates
If you need more customization than the default template provides, you can publish the view:
php artisan vendor:publish --tag=laravolt-viewsThen edit the statistic component view at resources/views/vendor/laravolt/statistic/default.blade.php.
Examples
Basic User Counter
class TotalUsers extends Statistic{ public string $label = 'Registered Users'; public ?string $icon = 'users'; public ?string $color = 'blue'; public function value(): int|string { return \App\Models\User::count(); }}Revenue Monitor with Formatting
class TotalRevenue extends Statistic{ public string $label = 'Monthly Revenue'; public ?string $icon = 'money-bill'; public ?string $color = 'green'; public function value(): int|string { $revenue = Order::whereMonth('created_at', now()->month) ->whereYear('created_at', now()->year) ->sum('total'); return 'Rp ' . number_format($revenue, 0, ',', '.'); }}Dynamic Task Status
class PendingTasks extends Statistic{ public string $label = 'Pending Tasks'; public function icon(): ?string { $count = $this->value(); if ($count > 10) { return 'exclamation-triangle'; } return 'tasks'; } public function color(): ?string { $count = $this->value(); if ($count > 10) { return 'red'; } elseif ($count > 5) { return 'yellow'; } return 'green'; } public function value(): int|string { return \App\Models\Task::where('status', 'pending')->count(); }}Best Practices
Keep It Simple
- Statistics components are most effective when they show a single, clear value
- Avoid complex calculations that could slow page loading
- Use appropriate formatting to make large numbers readable
Provide Context
- Choose clear, descriptive labels
- Use colors consistently throughout your application
- Consider adding trends or comparisons to previous periods
Performance Considerations
- For expensive calculations, consider caching the results
- Use database aggregations rather than PHP calculations when possible
- If polling for updates, keep the interval reasonable (5+ seconds)
Troubleshooting
Component Not Updating
If your statistic component isn't updating:
- Check that Livewire is properly installed and working
- Verify that your component's namespace matches its location
- Clear view cache and compiled assets:Bashphp artisan view:clearphp artisan livewire:discover
Icons Not Displaying
If icons aren't showing up:
- Ensure Font Awesome is properly loaded in your layout
- Verify you're using icon names available in Font Awesome v5
- Check console for any JavaScript errors
Related Components
- Charts - For displaying more complex data visualizations
- Tables - For displaying tabular data
- Dashboard Layouts - For arranging multiple statistics components